Confusion Matrix
A confusion matrix is a statistical tool used in machine learning and data analysis to evaluate the accuracy of a predictive model. It is a table that summarizes the performance of a classification model by comparing the predicted and actual values of a set of observations. The confusion matrix is also known as an error matrix, contingency table, or classification matrix.
The confusion matrix consists of four components: true positive (TP), false positive (FP), true negative (TN), and false negative (FN). These components represent the number of correct and incorrect predictions made by the model. Here is a simple example to illustrate the components of a confusion matrix:
Example-Confusion Matrix
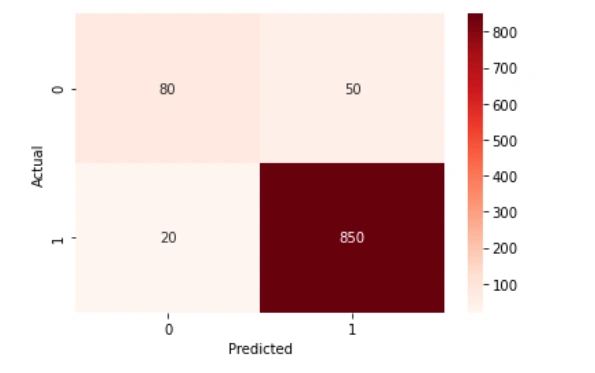
Suppose a predictive model is trained to predict whether a patient has a certain disease based on their medical history. The model predicts that 100 patients have the disease, and 80 of them actually have the disease (true positive). However, 20 of them do not have the disease (false positive). The model also predicts that 900 patients do not have the disease, and 850 of them do not have the disease (true negative). However, 50 of them actually have the disease (false negative). The confusion matrix for this example would look like this:
| Predicted Positive | Predicted Negative | |
|---|---|---|
| Actual Positive | TP=80 | FN=50 |
| Actual Negative | FP=20 | TN=850 |
True positive (TP) represents the number of patients who actually have the disease and were correctly identified by the model as having the disease. False positive (FP) represents the number of patients who do not have the disease but were incorrectly identified by the model as having the disease. True negative (TN) represents the number of patients who do not have the disease and were correctly identified by the model as not having the disease. False negative (FN) represents the number of patients who actually have the disease but were incorrectly identified by the model as not having the disease.
Heat Map

From the confusion matrix, we can calculate various performance metrics of the model. Here are some commonly used metrics:
- Accuracy: It is the proportion of correct predictions among all predictions made by the model. It is calculated as (TP+TN)/(TP+FP+TN+FN). In our example, the accuracy of the model would be (80+850)/(1000) = 93%.
- Precision: It is the proportion of true positive predictions among all positive predictions made by the model. It is calculated as TP/(TP+FP). In our example, the precision of the model would be 80/(80+20) = 80%.
- Recall: It is the proportion of true positive predictions among all actual positive cases. It is calculated as TP/(TP+FN). In our example, the recall of the model would be 80/(80+50) = 62.5%.
- F1 score: It is the harmonic mean of precision and recall. It is calculated as 2*(precisionrecall)/(precision+recall). In our example, the F1 score of the model would be 2(0.8*0.625)/(0.8+0.625) = 0.705.
- Specificity: It is the proportion of true negative predictions among all actual negative cases. It is calculated as TN/(TN+FP). In our example, the specificity of the model would be 850/(850+20) = 97.7%.
The confusion matrix can also be used to visualize the performance of the model. For example, we can plot a heat map of the matrix to show the proportion of correct and incorrect predictions.
Advertisement
Advertisement